
One of our WordPress websites was running very slow, so I have been asked to diagnose the application. The website was running in upwards of 6 seconds to load the homepage, and 8+ seconds to load woocommerce product pages. There are several debugging and profiling tools available in the PHP realm, and Xdebug is an excellent choice. New Relic (free and premium versions) is another choice for profiling and debugging PHP applications.
Before we begin profiling a web application with Xdebug, we need to install the extension. Installing Xdebug is fairly simple if you follow the installation instructions.
Beside providing you with more debugging information on PHP Errors, Xdebug also allows you to save profiling information to a log file and use KCacheGrind (Linux) or WinCacheGrind (Windows) to analyze the execution of PHP scripts. To enable profiling, we'll need to edit the php.ini file.
Within php.ini, create a section called [xdebug] and add the following configuration settings. You'll need to create an output directory (/var/log/xdebug), and allow a web user (i.e. apache) to write to that directory.
# mkdir /var/log/xdebug
# chmod 777 /var/log/xdebug
If you wish to enable profiling only when needed, you will add the following lines in the php.ini file. To enable profiling in your PHP script, you'll need to add a GET parameter XDEBUG_PROFILE to your URL.
[xdebug]
xdebug.profiler_enable=0
xdebug.profiler_output_dir="/var/log/xdebug"
xdebug.profiler_output_name="cachegrind.out.%R-%t-%s"
xdebug.profiler_append=On
xdebug.profiler_enable_trigger=On
xdebug.trace_options=1
xdebug.collect_params=4
xdebug.collect_return=1
xdebug.collect_vars=0
Add the following lines in the php.ini configuration file to enable Xdebug Profiling entirely. Be warned if you plan to use this option as Xdebug saves a lot of data in its profiling log. Ensure that you have plenty of storage space in the server, and clean up old log files as often as necessary.
[xdebug]
xdebug.profiler_enable=1
xdebug.profiler_append=On
xdebug.profiler_output_dir="/var/log/xdebug"
xdebug.profiler_output_name="cachegrind.out.%R-%t-%s"
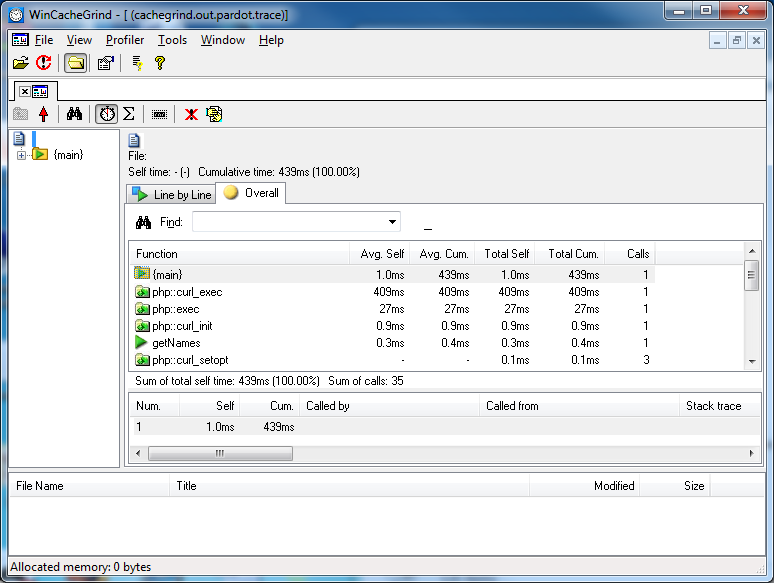
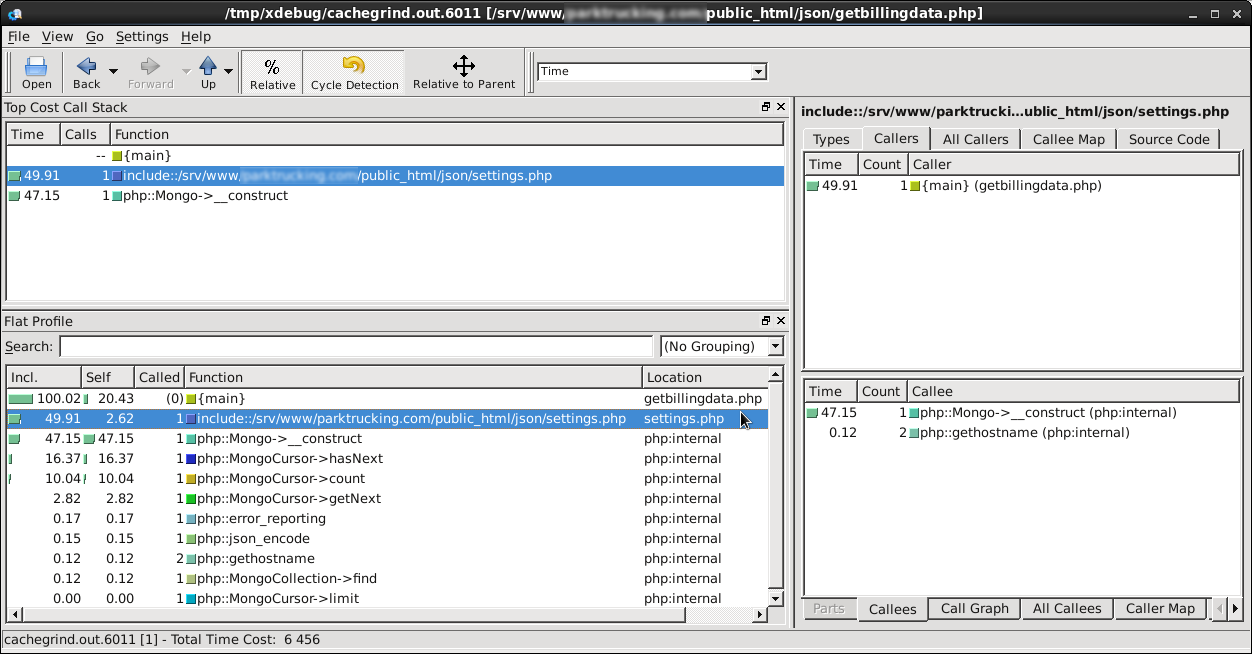
Upon successful profiling of PHP scripts, Xdebug will create a CacheGrind-compatible log file in the /var/log/xdebug folder. You will need an analysis tool such as the KCacheGrind (Linux) or WinCacheGrind (Windows) application to analyze the profiling data. Here is an example of KCacheGrind and WinCacheGrind in action.
Share this post
Leave a comment
All comments are moderated. Spammy and bot submitted comments are deleted. Please submit the comments that are helpful to others, and we'll approve your comments. A comment that includes outbound link will only be approved if the content is relevant to the topic, and has some value to our readers.
Comments (0)
No comment